


About conditional breakpoints
published at 18.08.2022 14:14 by Jens Weller
Save to Instapaper Pocket
A few weeks ago someone asked me for advice on finding a specific bug in a larger C++ code base...
I don't remember much of the details, but one of the challenges was that at least some of the code based used public members, and in order to find the bug a change in these members is what they wanted to understand. Adding out put statements into a setter function wasn't possible, as the code did not have those. My suggestion was using a conditional breakpoint. And it also made me curious, if and how they're used with in our community.
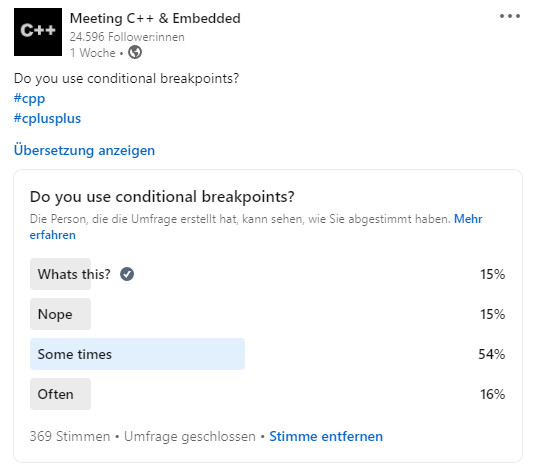
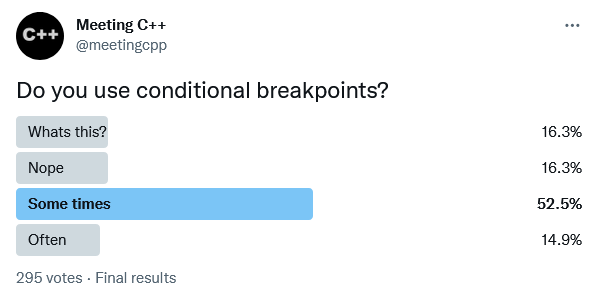
So I created two polls, one for Twitter and one for LinkedIn. Both gave very similar results: about 15% don't use them at all, and another ~15% doesn't even know about them. A bit more then 50% use them sometimes, and 16% use them often. With these results it makes sense to go a bit deeper into what conditional break points are.
What is a conditional breakpoint?
A breakpoint will halt the debugger on a specific line of code. This can be very useful, and for my own debugging sessions its often enough. But in other cases, it leads to stopping a program in the debugger again and again. And thats where a conditional breakpoint can shine. Depending on your debugger, there are various things you can have a breakpoint watch for its activation.
In most IDEs you'll have to right click on the break point, which then often shows a context menu with an item to edit its features. This will open a dialog, where you have various options, like entering a simple condition like break here if this variable is greater then 1024. You also can set a counter, to stop after a certain iteration. You may be able to specify the thread or combine more then one condition.
Your condition usually has access to what the debugger can see, so you can check for values of various variables, and even write your own little function in some debuggers. But usually you should not be able to call into other functions or do other things that have side effects.
What is available to you will also depend on your debugging frontend. So here is some links to various articles for indepth tutorials on this:
- Understanding conditional breakpoints in (Visual) C++
- Using Breakpoints in Visual Studio
- Setting breakpoints in QtCreator
- GDB watchpoints
- GDB conditional breakpoints
- Breakpoints in CLion
- Using breakpoints in CLion
Its a tool in your toolbelt
It should be mentioned, that this is just one of the tools a debugger has. Once your breakpoint has fired, a look into the callstack might help to understand where your code came from. In the past I've turned to conditional breakpoints often, when the callstack did not give an obvious answer in the first place though. When you look for the source of a corruption, try to understand the runtime conditions that lead to a crash, the various options and conditions you can set on a breakpoint can be of great help.
There is an obvious down side though. Depending on how many conditions you may want to check, the more this will influence the execution and timing of your program. If a bug is depending on a certain timing, this can have an influence on if and how often a certain bug is showing up in your debug session. In this case, it can be of help to watch the memory, and not a specific variable.
And you should be aware about the other options you have to catch bugs. Sanitizers can help you find lots things in your code base which currently "just works", but may break in the future. Debugging multithreaded code can be difficult, and the thread sanitizer might be the right tool to turn to if your first debugging session did not pinpoint the cause.
Also using time travel debugging can be an option:
- 6 Things you need to know about time travel debugging
- Time travel debugging for Visual Studio Enterprise 2019
Join the Meeting C++ patreon community!
This and other posts on Meeting C++ are enabled by my supporters on patreon!